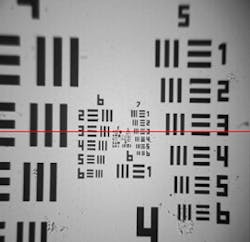
Resolution is a measurement of an imaging system’s ability to resolve the object which is be imaged. Test targets are typically tools that are used to check the resolution of an imaging system. The most popular targets consist of “groups” of 6 “elements” and each element consists of three horizontal and three vertical bars equally spaced with well-defined width. The vertical bars are used to calculate horizontal resolution and horizontal bars are used to calculate vertical resolution.
Analyzing test target image is to identify the Group Element number of highest spatial frequency where either horizontal or vertical lines are distinguishable. Here is an example of such test target image:
To look at the pixel values we have chosen one row which is close to the center of the image. We see that the maximum pixel brightness is 120 counts at the center and about 95 counts at the edge for the test target image. Maximum theoretical pixel value for an 8-bit format image is 255 counts, thus only half of the sensor dynamic range is used for this test.
Groups are labeled by numbers in order of increasing frequency. It is obvious that Groups with highest resolution are near the image center. The image part, where the groups 8 and 9 are located, is shown here:
To avoid repetitions, we only show the calculation results for the resolution along the horizontal / X direction. To reduce the noise in calculation of the image contrast, each group image of the 3 vertical bars was averaged along Y direction inside the extent of the black bars.
The resulting averaged amplitudes along X direction for all the elements of the group 8 are shown here:
The signal amplitude difference between black stripe/line and white space is recognizable for the 6 elements of Group 8, i.e., all the 6 elements are distinguishable
Next picture shows the same kind of plot for all the elements of the group 9:
The signal amplitude difference between black bar/line and white space is countable for the elements 1-5 but is not distinguishable for the element 6 of group 9.
The resolution of this imaging system is Group-9 Element-5 with line width of 0.62µm, i.e., frequency of 806 line pairs per mm. It is known that the resolution of an imaging system can be affected by factors such as object/test target contrast, lighting source intensity, and software correction. Increasing the illumination intensity and having proper parameter settings for the camera can improve the resolution of the imaging system.
